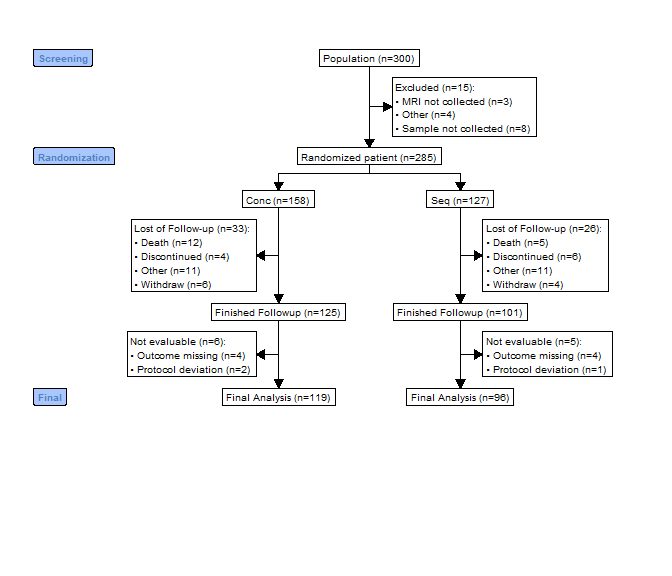
The goal of consort is to make it easy to create CONSORT diagrams for the transparent reporting of participant allocation in randomized, controlled clinical trials. This is done by creating a standardized disposition data, and using this data as the source for the creation a standard CONSORT diagram. Human effort by supplying text labels on the node can also be achieved.
You can install the released version of consort from CRAN with:
And the development version from GitHub with:
This is a basic example which shows you how to solve a create CONSORT diagram with a given subject disposition data:
set.seed(1001)
N <- 300

trialno <- sample(c(1000:2000), N)
exc <- rep(NA, N)
exc[sample(1:N, 15)] <- sample(c("Sample not collected", "MRI not collected", "Other"),
                                15, replace = T, prob = c(0.4, 0.4, 0.2))

arm <- rep(NA, N)
arm[is.na(exc)] <- sample(c("Conc", "Seq"), sum(is.na(exc)), replace = T)

fow1 <- rep(NA, N)
fow1[!is.na(arm)] <- sample(c("Withdraw", "Discontinued", "Death", "Other", NA),
                            sum(!is.na(arm)), replace = T,
                            prob = c(0.05, 0.05, 0.05, 0.05, 0.8))
fow2 <- rep(NA, N)
fow2[!is.na(arm) & is.na(fow1)] <- sample(c("Protocol deviation", "Outcome missing", NA),
                                          sum(!is.na(arm) & is.na(fow1)), replace = T,
                                          prob = c(0.05, 0.05, 0.9))
df <- data.frame(trialno, exc, arm, fow1, fow2)
head(df)
#>   trialno  exc  arm  fow1 fow2
#> 1    1086 <NA> Conc  <NA> <NA>
#> 2    1418 <NA>  Seq  <NA> <NA>
#> 3    1502 <NA> Conc Death <NA>
#> 4    1846 <NA> Conc  <NA> <NA>
#> 5    1303 <NA> Conc Death <NA>
#> 6    1838 <NA>  Seq  <NA> <NA>
out <- consort_plot(data = df,
order = c(trialno = "Population",
exc = "Excluded",
arm = "Randomized patient",
fow1 = "Lost of Follow-up",
trialno = "Finished Followup",
fow2 = "Not evaluable",
trialno = "Final Analysis"),
side_box = c("exc", "fow1", "fow2"),
allocation = "arm",
labels = c("1" = "Screening", "2" = "Randomization",
"5" = "Final"),
dist = 0.02,
cex = 0.6)
plot(out)