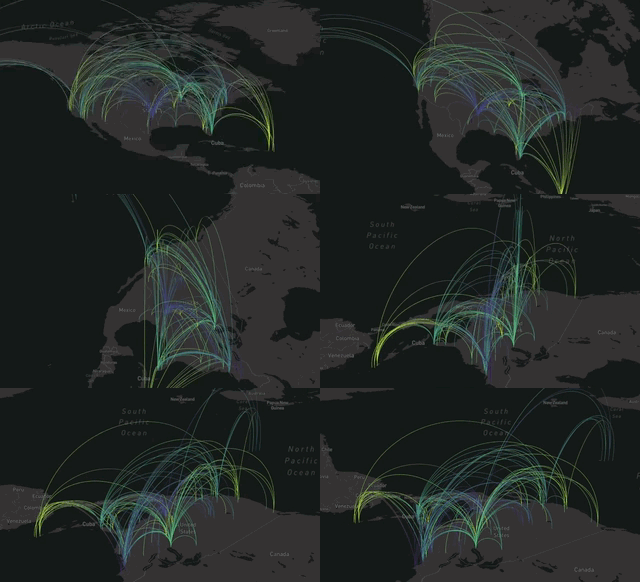

An R library which lets you plot large data sets (as much as your GPU & browser can handle), on interactive maps using Mapbox GL and Deck.gl

Mapbox is the location data platform for mobile and web applications. We provide building blocks to add location features like maps, search, and navigation into any experience you create.
deck.gl is a WebGL-powered framework for visual exploratory data analysis of large datasets.
First you need to install it, either from CRAN
Or from github (to get the latest development version)
Then everything you need to know to get you started is on the home page
Mapdeck uses Mapbox maps, and to use Mapbox you need an access token.
Once you’ve generate a token you can use their maps.
Call mapdeck(token = 'your_token') to generate a basic map. Then start adding layers by using one of the various add_*() functions.
url <- 'https://raw.githubusercontent.com/plotly/datasets/master/2011_february_aa_flight_paths.csv'
flights <- read.csv(url)
flights$info <- paste0("<b>",flights$airport1, " - ", flights$airport2, "</b>")

mapdeck(token = key, style = mapdeck_style('dark')) %>%
  add_arc(
    data = flights
    , origin = c("start_lon", "start_lat")
    , destination = c("end_lon", "end_lat")
    , stroke_from = "airport1"
    , stroke_to = "airport2"
    , tooltip = "info"
    , layer_id = 'arclayer'
  )
See the Layers page for more examples
For general help and advice the best place to ask is on StackOverflow (using the mapdeck tag).
If you’ve found a bug, or want a new feature added then use the issue tracker on github.
I don’t respond to emails asking for help because this is an open source package, and any advice should be kept open so everyone can benefit. (unless you want to pay me!)