
The goal of plsRbeta is to provide Partial least squares Regression for (weighted) beta regression models (Bertrand 2013, http://journal-sfds.fr/article/view/215) and k-fold cross-validation of such models using various criteria. It allows for missing data in the explanatory variables. Bootstrap confidence intervals constructions are also available.
The package was accepted for presentation at the the useR! 2021 international conference. A technical note for the package was created and published on the website of the conference. It can be accessed here: https://user2021.r-project.org/participation/technical_notes/t138/technote/. It is not only an english translation of most of the contents of the original article that was published in French but it also contains the R code reproduce the two examples that were presented in the article.
This website and these examples were created by F. Bertrand and M. Maumy-Bertrand.
You can install the released version of plsRbeta from CRAN with:
install.packages("plsRbeta")You can install the development version of plsRbeta from github with:
devtools::install_github("fbertran/plsRbeta")Fit a plsRbeta model using a model matrix.
data("GasolineYield",package="betareg")
yGasolineYield <- GasolineYield$yield
XGasolineYield <- GasolineYield[,2:5]
library(plsRbeta)
modpls <- plsRbeta(yGasolineYield,XGasolineYield,nt=3,modele="pls-beta")
#> ____************************************************____
#>
#> Model: pls-beta
#>
#> Link: logit
#>
#> Link.phi:
#>
#> Type: ML
#>
#> ____Component____ 1 ____
#> ____Component____ 2 ____
#> ____Component____ 3 ____
#> ____Predicting X without NA neither in X nor in Y____
#> ****________________________________________________****
print(modpls)
#> Number of required components:
#> [1] 3
#> Number of successfully computed components:
#> [1] 3
#> Coefficients:
#>                   [,1]
#> Intercept -3.324462301
#> gravity    0.001577508
#> pressure   0.072027686
#> temp10    -0.008398771
#> temp       0.010365973
#> Information criteria and Fit statistics:
#>                  AIC        BIC Chi2_Pearson_Y      RSS_Y pseudo_R2_Y
#> Nb_Comp_0  -52.77074  -49.83927       30.72004 0.35640772          NA
#> Nb_Comp_1 -112.87383 -108.47662       30.57369 0.05211039   0.8498691
#> Nb_Comp_2 -136.43184 -130.56889       30.97370 0.02290022   0.9256771
#> Nb_Comp_3 -139.08440 -131.75572       31.08224 0.02022386   0.9385887
#>                R2_Y
#> Nb_Comp_0        NA
#> Nb_Comp_1 0.8537900
#> Nb_Comp_2 0.9357471
#> Nb_Comp_3 0.9432564
Additionnal values can be retrieved from the fitted model.
modpls$pp
#>             Comp_ 1    Comp_ 2    Comp_ 3
#> gravity   0.4590380 -0.4538663 -2.5188256
#> pressure  0.6395524 -0.4733525  0.6488823
#> temp10   -0.5435643  0.5292108 -1.3295905
#> temp      0.5682795  0.5473174 -0.2156423
modpls$Coeffs
#>                   [,1]
#> Intercept -3.324462301
#> gravity    0.001577508
#> pressure   0.072027686
#> temp10    -0.008398771
#> temp       0.010365973
modpls$Std.Coeffs
#>                   [,1]
#> Intercept -1.547207760
#> gravity    0.008889933
#> pressure   0.188700277
#> temp10    -0.315301400
#> temp       0.723088387
modpls$InfCrit
#>                  AIC        BIC Chi2_Pearson_Y
#> Nb_Comp_0  -52.77074  -49.83927       30.72004
#> Nb_Comp_1 -112.87383 -108.47662       30.57369
#> Nb_Comp_2 -136.43184 -130.56889       30.97370
#> Nb_Comp_3 -139.08440 -131.75572       31.08224
#>                RSS_Y pseudo_R2_Y      R2_Y
#> Nb_Comp_0 0.35640772          NA        NA
#> Nb_Comp_1 0.05211039   0.8498691 0.8537900
#> Nb_Comp_2 0.02290022   0.9256771 0.9357471
#> Nb_Comp_3 0.02022386   0.9385887 0.9432564
modpls$PredictY[1,]
#>   gravity  pressure    temp10      temp
#>  2.049533  1.686655 -1.371820 -1.821977
rm("modpls")
###Formula support
Fit a plsRbeta model using formula support.
data("GasolineYield",package="betareg")
modpls <- plsRbeta(yield~.,data=GasolineYield,nt=3,modele="pls-beta", verbose=FALSE)
print(modpls)
#> Number of required components:
#> [1] 3
#> Number of successfully computed components:
#> [1] 3
#> Coefficients:
#>                    [,1]
#> Intercept -4.1210566077
#> gravity    0.0157208676
#> pressure   0.0305159627
#> temp10    -0.0074167766
#> temp       0.0108057945
#> batch1     0.0910284843
#> batch2     0.1398537354
#> batch3     0.2287070465
#> batch4    -0.0008124326
#> batch5     0.1018679027
#> batch6     0.1147971957
#> batch7    -0.1005469609
#> batch8    -0.0447907428
#> batch9    -0.0706292318
#> batch10   -0.1984703429
#> Information criteria and Fit statistics:
#>                  AIC        BIC Chi2_Pearson_Y      RSS_Y pseudo_R2_Y
#> Nb_Comp_0  -52.77074  -49.83927       30.72004 0.35640772          NA
#> Nb_Comp_1  -87.96104  -83.56383       31.31448 0.11172576   0.6879757
#> Nb_Comp_2 -114.10269 -108.23975       33.06807 0.04650238   0.8671800
#> Nb_Comp_3 -152.71170 -145.38302       30.69727 0.01138837   0.9526757
#>                R2_Y
#> Nb_Comp_0        NA
#> Nb_Comp_1 0.6865226
#> Nb_Comp_2 0.8695248
#> Nb_Comp_3 0.9680468
Additionnal values can be retrieved from the fitted model.
modpls$pp
#>              Comp_ 1     Comp_ 2     Comp_ 3
#> gravity   0.37895923 -0.42864981  0.50983922
#> pressure  0.61533000 -0.41618828 -0.01737302
#> temp10   -0.50627633  0.47379983 -0.47750566
#> temp      0.30248369  0.60751756  0.28239621
#> batch1    0.50274128 -0.30221156 -0.25801764
#> batch2   -0.14241033 -0.13859422  0.80068659
#> batch3   -0.04388172 -0.17303214  0.48564161
#> batch4    0.11299471 -0.08302689  0.04755182
#> batch5    0.23341035  0.08396326 -0.51238456
#> batch6    0.07974302  0.07209943 -0.30710455
#> batch7   -0.37365392 -0.02133356  0.81852001
#> batch8   -0.12891598  0.16967195 -0.06904725
#> batch9   -0.02230288  0.19425476 -0.57189134
#> batch10  -0.25409429  0.28587553 -0.61277072
modpls$Coeffs
#>                    [,1]
#> Intercept -4.1210566077
#> gravity    0.0157208676
#> pressure   0.0305159627
#> temp10    -0.0074167766
#> temp       0.0108057945
#> batch1     0.0910284843
#> batch2     0.1398537354
#> batch3     0.2287070465
#> batch4    -0.0008124326
#> batch5     0.1018679027
#> batch6     0.1147971957
#> batch7    -0.1005469609
#> batch8    -0.0447907428
#> batch9    -0.0706292318
#> batch10   -0.1984703429
modpls$Std.Coeffs
#>                    [,1]
#> Intercept -1.5526788976
#> gravity    0.0885938394
#> pressure   0.0799466278
#> temp10    -0.2784359925
#> temp       0.7537685874
#> batch1     0.0305865495
#> batch2     0.0414169259
#> batch3     0.0677303525
#> batch4    -0.0002729861
#> batch5     0.0301676274
#> batch6     0.0339965674
#> batch7    -0.0337848600
#> batch8    -0.0132645358
#> batch9    -0.0173701781
#> batch10   -0.0587759166
modpls$InfCrit
#>                  AIC        BIC Chi2_Pearson_Y
#> Nb_Comp_0  -52.77074  -49.83927       30.72004
#> Nb_Comp_1  -87.96104  -83.56383       31.31448
#> Nb_Comp_2 -114.10269 -108.23975       33.06807
#> Nb_Comp_3 -152.71170 -145.38302       30.69727
#>                RSS_Y pseudo_R2_Y      R2_Y
#> Nb_Comp_0 0.35640772          NA        NA
#> Nb_Comp_1 0.11172576   0.6879757 0.6865226
#> Nb_Comp_2 0.04650238   0.8671800 0.8695248
#> Nb_Comp_3 0.01138837   0.9526757 0.9680468
modpls$PredictY[1,]
#>    gravity   pressure     temp10       temp
#>  2.0495333  1.6866554 -1.3718198 -1.8219769
#>     batch1     batch2     batch3     batch4
#>  2.6040833 -0.3165683 -0.3165683 -0.3720119
#>     batch5     batch6     batch7     batch8
#> -0.3165683 -0.3165683 -0.3720119 -0.3165683
#>     batch9    batch10
#> -0.2541325 -0.3165683
###Information criteria and cross validation
data("GasolineYield",package="betareg")
set.seed(1)
bbb <- PLS_beta_kfoldcv_formula(yield~.,data=GasolineYield,nt=3,modele="pls-beta",verbose=FALSE)
kfolds2CVinfos_beta(bbb)
#> ____************************************************____
#>
#> Model: pls-beta
#>
#> Link: logit
#>
#> Link.phi:
#>
#> Type: ML
#>
#> ____Component____ 1 ____
#> ____Component____ 2 ____
#> ____Component____ 3 ____
#> ____Predicting X without NA neither in X or Y____
#> ****________________________________________________****
#>
#> NK: 1
#> [[1]]
#>                  AIC        BIC Q2Chisqcum_Y  limQ2 Q2Chisq_Y
#> Nb_Comp_0  -52.77074  -49.83927           NA     NA        NA
#> Nb_Comp_1  -87.96104  -83.56383    -1.121431 0.0975 -1.121431
#> Nb_Comp_2 -114.10269 -108.23975    -5.291744 0.0975 -1.965802
#> Nb_Comp_3 -152.71170 -145.38302   -11.583916 0.0975 -1.000068
#>           PREChi2_Pearson_Y Chi2_Pearson_Y      RSS_Y pseudo_R2_Y
#> Nb_Comp_0                NA       30.72004 0.35640772          NA
#> Nb_Comp_1          65.17044       31.31448 0.11172576   0.6879757
#> Nb_Comp_2          92.87255       33.06807 0.04650238   0.8671800
#> Nb_Comp_3          66.13838       30.69727 0.01138837   0.9526757
#>                R2_Y
#> Nb_Comp_0        NA
#> Nb_Comp_1 0.6865226
#> Nb_Comp_2 0.8695248
#> Nb_Comp_3 0.9680468
###Bootstrap of the coefficients
Computing bootstrap distributions
data("GasolineYield",package="betareg")
set.seed(1)
GazYield.boot <- bootplsbeta(modpls, sim="ordinary", stype="i", R=250)
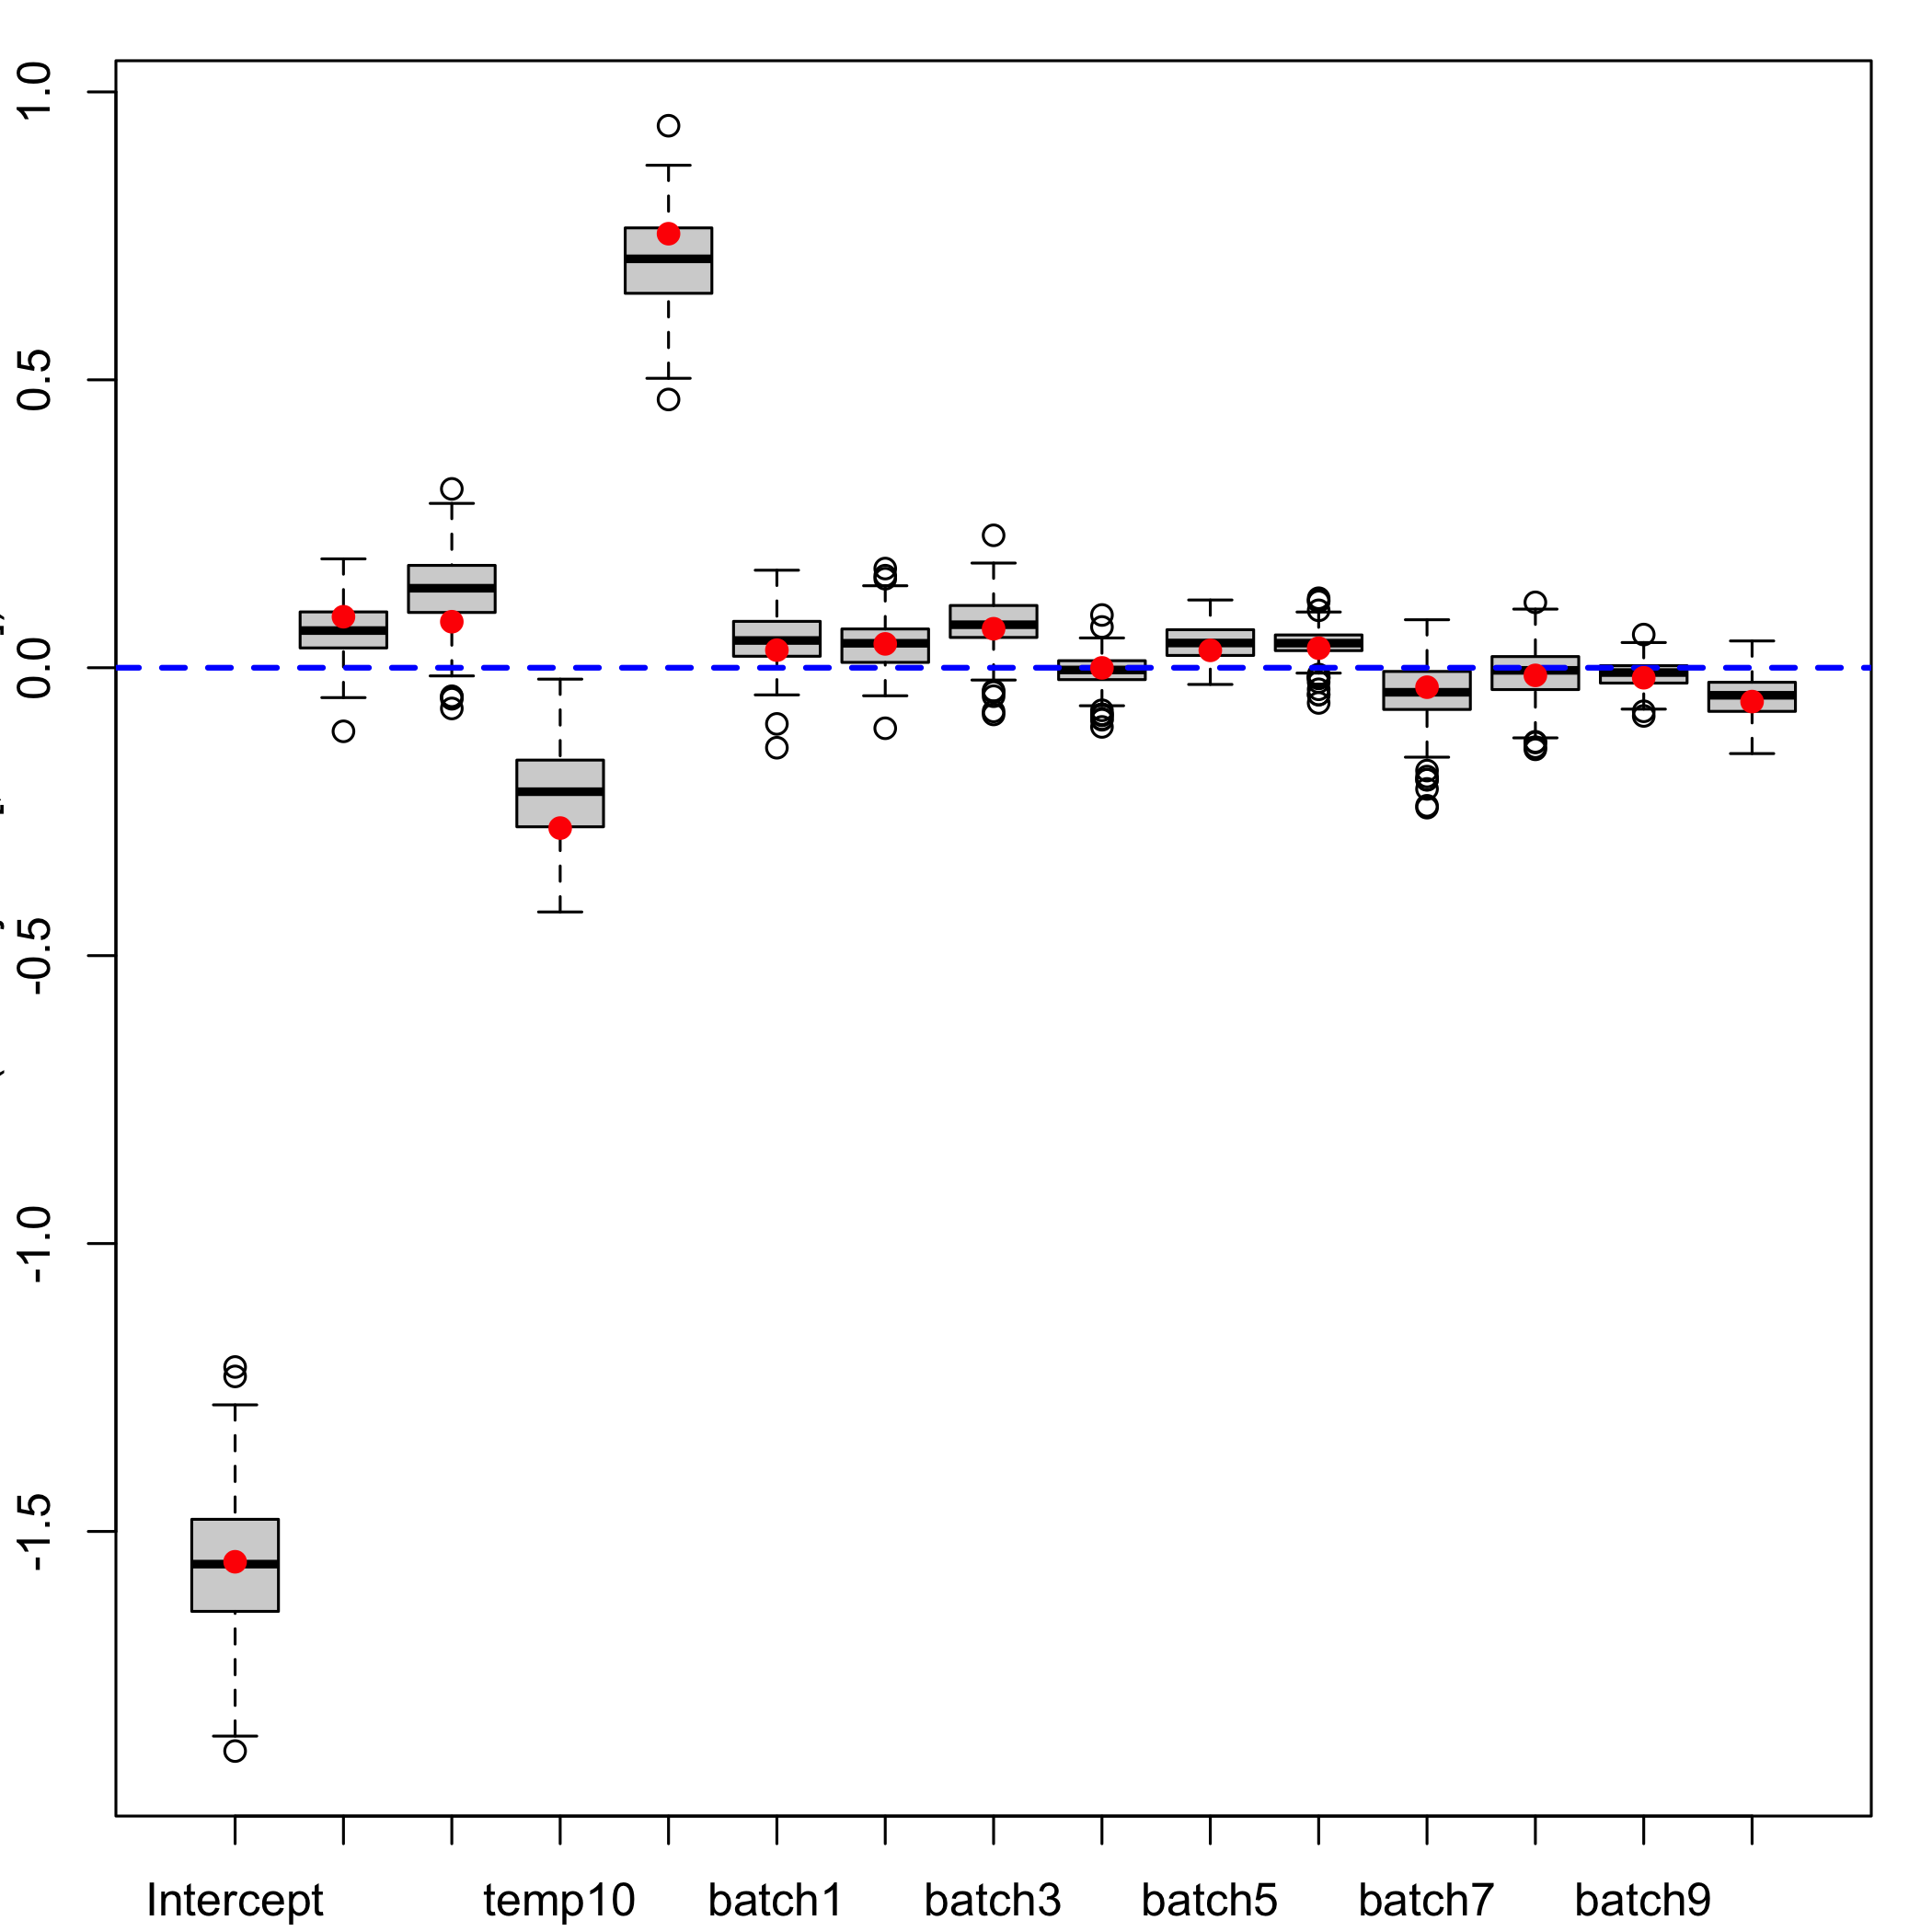
Boxplots of the bootstrap distributions
plsRglm::boxplots.bootpls(GazYield.boot)
Confidence intervals for the coefficients of the model based on the bootstrap distributions
plsRglm::confints.bootpls(GazYield.boot)
#>
#> Intercept -1.79344379 -1.298344159 -1.820910539
#> gravity    0.01927751  0.203207700  0.009687132
#> pressure  -0.10284957  0.158899010 -0.095122794
#> temp10    -0.50396889 -0.177603439 -0.520653497
#> temp       0.63958439  0.963623548  0.658889299
#> batch1    -0.09222398  0.110336215 -0.099261768
#> batch2    -0.04513338  0.126556137 -0.059420084
#> batch3    -0.04255156  0.157619185 -0.038503175
#> batch4    -0.05292024  0.065545216 -0.047023003
#> batch5    -0.04251041  0.078338536 -0.041090268
#> batch6    -0.02959175  0.082854597 -0.031393204
#> batch7    -0.13595057  0.097613550 -0.125280057
#> batch8    -0.11677718  0.084955543 -0.116202080
#> batch9    -0.06966369  0.023673543 -0.070353628
#> batch10   -0.14231213  0.006802744 -0.142929452
#>
#> Intercept -1.298811257 -1.80654654 -1.28444726
#> gravity    0.207137136 -0.02994946  0.16750055
#> pressure   0.205604518 -0.04571126  0.25501605
#> temp10    -0.184002462 -0.37286952 -0.03621849
#> temp       1.002068184  0.50546899  0.84864788
#> batch1     0.106680396 -0.04550730  0.16043487
#> batch2     0.119437955 -0.03660410  0.14225394
#> batch3     0.177505160 -0.04204445  0.17396388
#> batch4     0.081938870 -0.08248484  0.04647703
#> batch5     0.078484689 -0.01814943  0.10142552
#> batch6     0.104052342 -0.03605921  0.09938634
#> batch7     0.127028728 -0.19459845  0.05771034
#> batch8     0.101367639 -0.12789671  0.08967301
#> batch9     0.028700049 -0.06344040  0.03561327
#> batch10    0.007651461 -0.12520329  0.02537762
#>
#> Intercept -1.80046767 -1.282289852
#> gravity    0.02817987  0.189061113
#> pressure  -0.07071644  0.140622124
#> temp10    -0.42413912 -0.175831698
#> temp       0.64173410  0.941303333
#> batch1    -0.13892632  0.100909676
#> batch2    -0.03921924  0.141666087
#> batch3    -0.08110506  0.157875292
#> batch4    -0.06253836  0.077670517
#> batch5    -0.02899872  0.075247803
#> batch6    -0.06114337  0.066367369
#> batch7    -0.15688005  0.078620504
#> batch8    -0.13986427  0.063261668
#> batch9    -0.08371923  0.016030629
#> batch10   -0.14907794 -0.004437664
#> attr(,"typeBCa")
#> [1] TRUE
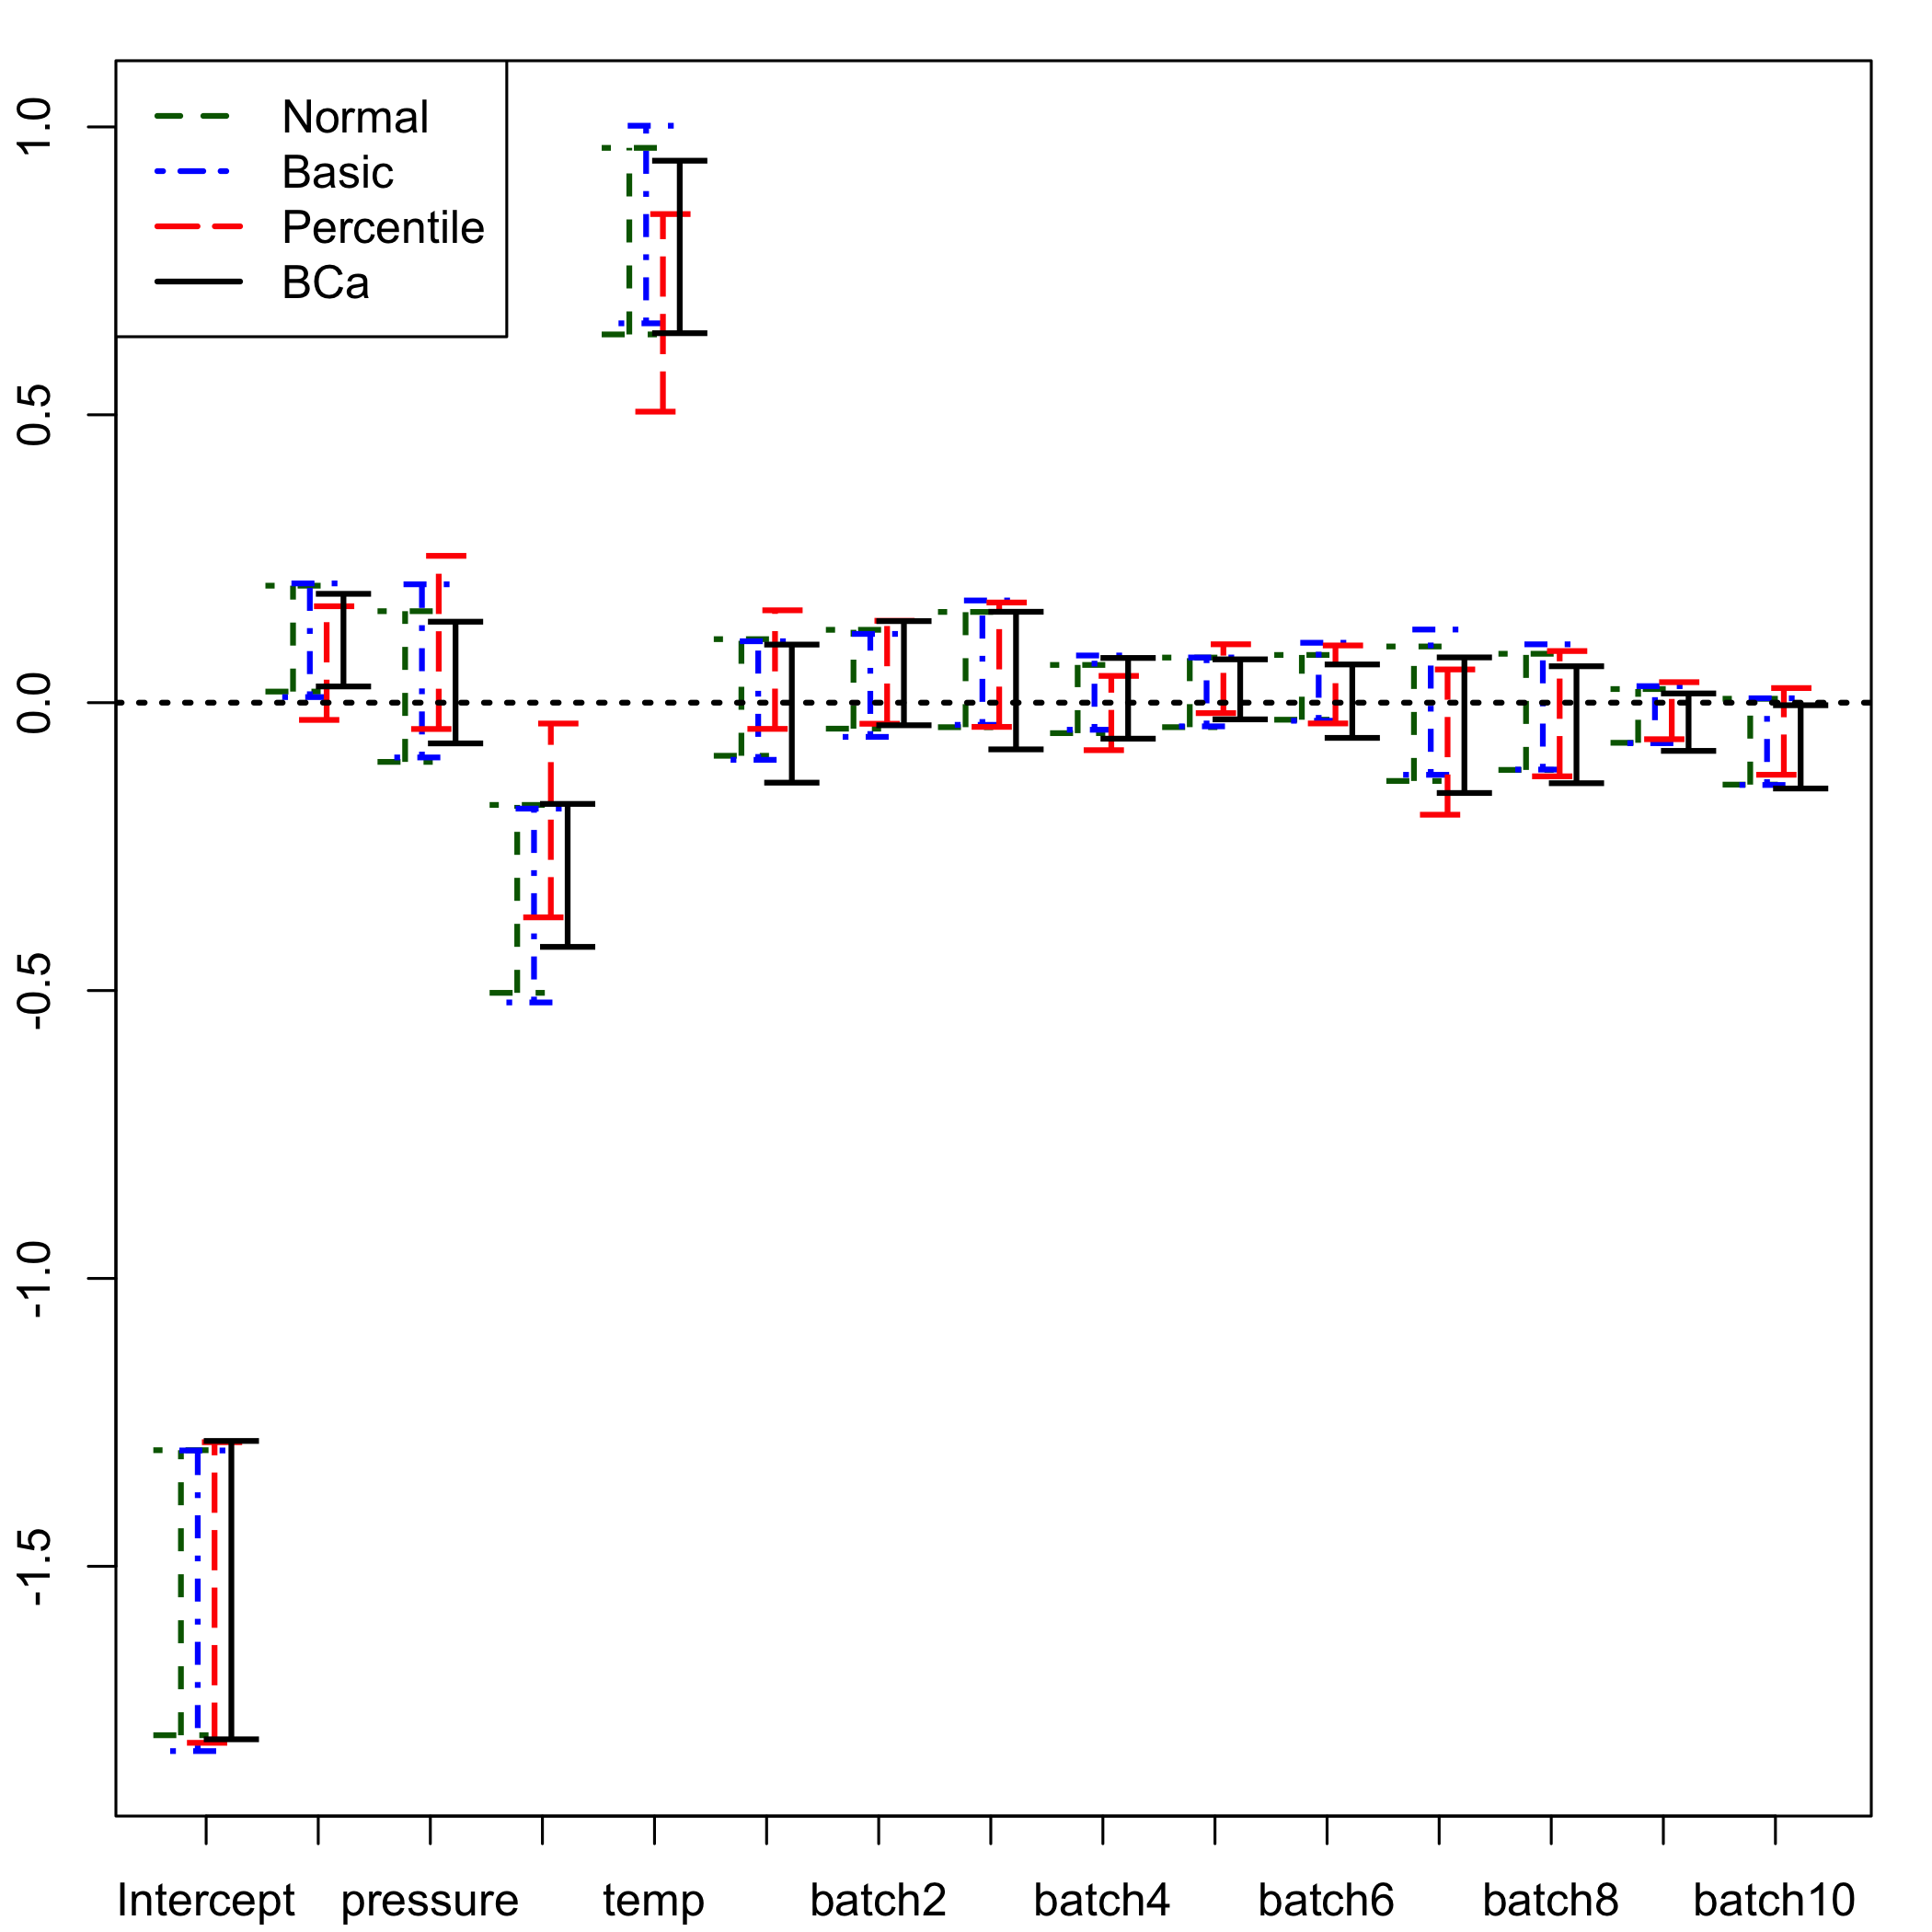
Plot of the confidence intervals for the coefficients of the model based on the bootstrap distributions
plsRglm::plots.confints.bootpls(plsRglm::confints.bootpls(GazYield.boot))