

The idea here is to create modular bits and pieces to allow you to add silhouettes to not only ggplot2 plots, but base plots as well.
CRAN version
Development version
Find the taxa in Phylopic whose names match some text
Get info on a name
# no options just returns the UUID (aka: self)
name_get(uuid = person$uid[1])
#> $uid
#> [1] "1ee65cf3-53db-4a52-9960-a9f7093d845d"
# specify fields to return with the `options` parameter
name_get(uuid = person$uid[1], options = c('citationStart', 'html'))
#> $html
#> [1] "<span class=\"nomen\"><span class=\"scientific\">Homo sapiens</span> <span class=\"citation\">Linnaeus, 1758</span></span>"
#>
#> $citationStart
#> [1] 13
#>
#> $uid
#> [1] "1ee65cf3-53db-4a52-9960-a9f7093d845d"
Searches for images for a taxonomic name.
name_images(uuid = person$uid[1])
#> $other
#> list()
#>
#> $supertaxa
#> list()
#>
#> $subtaxa
#> list()
#>
#> $same
#> $same[[1]]
#> $same[[1]]$uid
#> [1] "c089caae-43ef-4e4e-bf26-973dd4cb65c5"
#>
#>
#> $same[[2]]
#> $same[[2]]$uid
#> [1] "ad736445-7147-46f0-9932-d69243dea8f0"
#>
#>
#> $same[[3]]
#> $same[[3]]$uid
#> [1] "a146bf1b-c94d-46e1-9cd8-a0ac52a1e0a9"
Find the minimal common supertaxa for a list of names.
insect <- name_search('Orussus abietinus')[[1]]
bird <- name_search('Malacoptila panamensis')[[1]]
(x <- name_minsuptaxa(uuid = c(person$uid[1], insect$uid, bird$uid))[[1]])
#> $canonicalName
#> $canonicalName$uid
#> [1] "68226175-f88d-4ea8-8228-3204c49bfda0"
name_get(x$canonicalName$uid, options = c('string'))
#> $uid
#> [1] "68226175-f88d-4ea8-8228-3204c49bfda0"
#>
#> $string
#> [1] "Nephrozoa Jondelius & al. 2002"
Collect taxonomic data for a name.
name_taxonomy(uuid = "f3254fbd-284f-46c1-ae0f-685549a6a373",
  options = "string", as = "list")
#> $taxa
#> $taxa[[1]]
#> $taxa[[1]]$canonicalName
#> $taxa[[1]]$canonicalName$uid
#> [1] "f3254fbd-284f-46c1-ae0f-685549a6a373"
#>
#> $taxa[[1]]$canonicalName$string
#> [1] "Macrauchenia patachonica Owen 1838"
#>
#>
#>
#>
#> $uBioCommands
#> [1] FALSE
#>
#> $inclusions
#> list()Retrieves information on a set of taxonomic names.
id <- "8d9a9ea3-95cc-414d-1000-4b683ce04be2"
nameset_get(uuid = id, options = c('names', 'string'))
#> $uid
#> [1] "8d9a9ea3-95cc-414d-1000-4b683ce04be2"
#>
#> $names
#> $names[[1]]
#> $names[[1]]$uid
#> [1] "105d17a4-9706-4fd5-85d7-becffaf6250a"
#>
#> $names[[1]]$string
#> [1] "Homo sapiens sapiens Linnaeus 1758"
#>
#>
#> $names[[2]]
#> $names[[2]]$uid
#> [1] "9dc78907-02ca-4e98-95d7-f5a7c6166ee8"
#>
#> $names[[2]]$string
#> [1] "Canis familiaris familiaris"
Collects taxonomic data for a name.
nameset_taxonomy(uuid = "8d9a9ea3-95cc-414d-1000-4b683ce04be2", options = "string")$taxa[1:2]
#> [[1]]
#> [[1]]$canonicalName
#> [[1]]$canonicalName$uid
#> [1] "2265ff9d-cfcf-4bf4-9f3e-fb4dd9e90261"
#>
#> [[1]]$canonicalName$string
#> [1] "Choanozoa"
#>
#>
#>
#> [[2]]
#> [[2]]$canonicalName
#> [[2]]$canonicalName$uid
#> [1] "b909eda2-4a6d-4d87-a463-87cbe3d20c5f"
#>
#> [[2]]$canonicalName$string
#> [1] "Coelomata"Get info on an image
id <- "9fae30cd-fb59-4a81-a39c-e1826a35f612"
image_get(uuid = id)
#> $uid
#> [1] "9fae30cd-fb59-4a81-a39c-e1826a35f612"
Count images in Phylopic database
Lists images in chronological order, from most to least recently modified
image_list(start=1, length=2)
#> [[1]]
#> [[1]]$uid
#> [1] "d3a78afb-1b9e-45e0-b6f4-144d79f399f0"
#>
#>
#> [[2]]
#> [[2]]$uid
#> [1] "c7fbe213-1eac-4f81-80d0-674c3bd2d6b0"
Lists images within a given time range, from most to least recent
image_timerange(from="2013-05-11", to="2013-05-12", options='credit')[1:2]
#> [[1]]
#> [[1]]$credit
#> [1] "Emily Willoughby"
#>
#> [[1]]$uid
#> [1] "58daaa49-e699-448d-9553-ceedd1fc98a4"
#>
#>
#> [[2]]
#> [[2]]$credit
#> [1] "Gareth Monger"
#>
#> [[2]]$uid
#> [1] "303ddff0-6a51-4f70-adf7-69bb22385d6d"library('ggplot2')
img <- image_data("27356f15-3cf8-47e8-ab41-71c6260b2724", size = "512")[[1]]
qplot(x = Sepal.Length, y = Sepal.Width, data = iris, geom = "point") +
add_phylopic(img)
For ggplot2 graphics…
library('ggplot2')
img <- image_data("c089caae-43ef-4e4e-bf26-973dd4cb65c5", size = "64")[[1]]
p <- ggplot(mtcars, aes(drat, wt)) +
      geom_blank() +
      theme_grey(base_size = 18)
for (i in 1:nrow(mtcars)) {
  p <- p + add_phylopic(img, 1, mtcars$drat[i], mtcars$wt[i], ysize = 0.3)
}
p
and the same plot in base R graphics:
cat <- image_data("23cd6aa4-9587-4a2e-8e26-de42885004c9", size = 128)[[1]]
posx <- runif(50, 0, 1)
posy <- runif(50, 0, 1)
size <- runif(50, 0.01, 0.2)
plot(posx, posy, type = "n", main = "A cat herd")
for (i in 1:50) {
  add_phylopic_base(cat, posx[i], posy[i], size[i])
}
cat <- image_data("23cd6aa4-9587-4a2e-8e26-de42885004c9", size = 128)[[1]]
out <- save_png(cat)
identical(png::readPNG(out), cat)
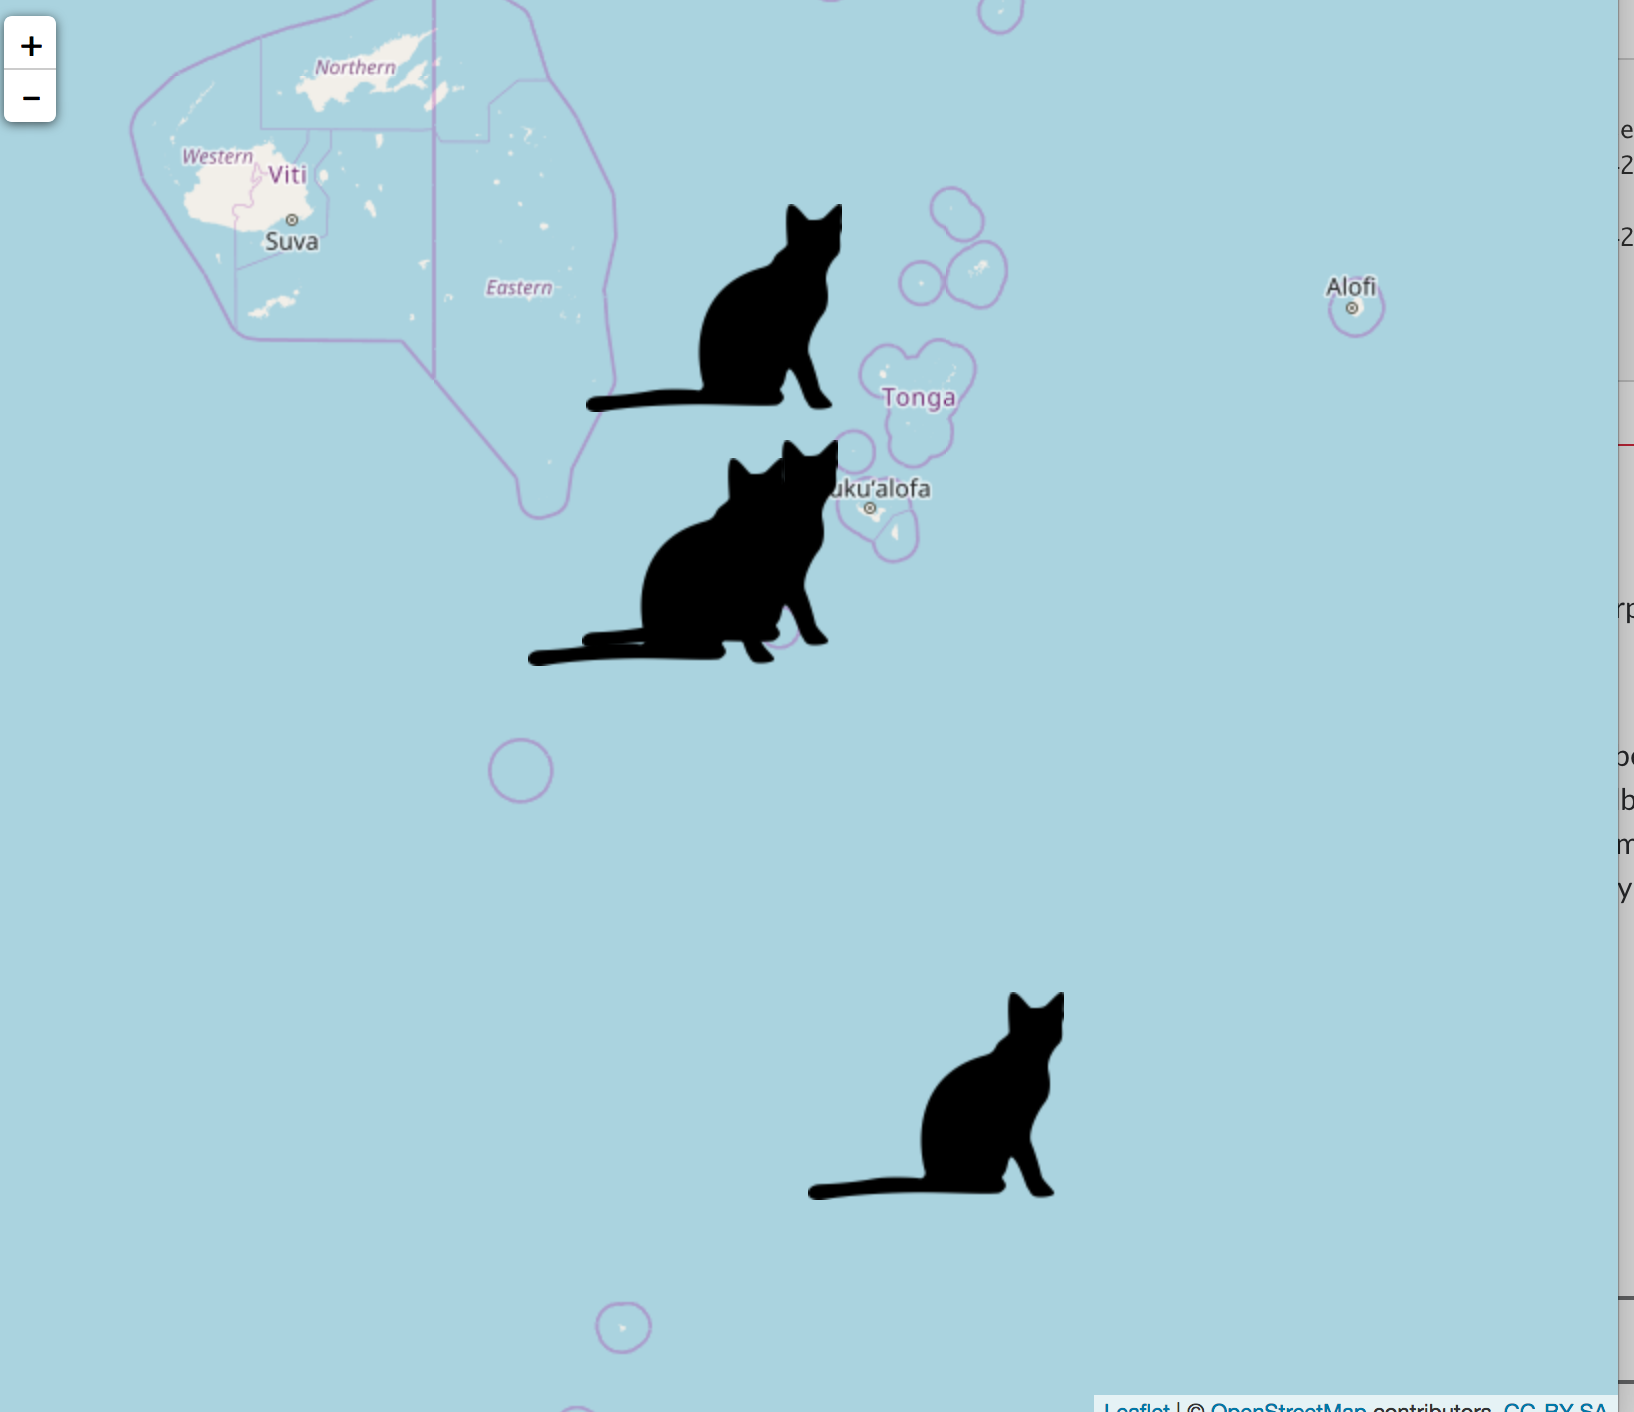
#> TRUEThere’s nothing baked into rphylopic for this, but here’s an example of how to do it.
library(leaflet)
data(quakes)

# get an image
cat <- image_data("23cd6aa4-9587-4a2e-8e26-de42885004c9", size = 128)[[1]]
# save to disk
file <- save_png(cat)
# make an icon. this one is super simple, see `makeIcon` docs for more options
sil_icon <- makeIcon(iconUrl = file)

# make the plot
leaflet(data = quakes[1:4,]) %>% addTiles() %>%
  addMarkers(~long, ~lat, icon = sil_icon)
rphylopic in R doing citation(package = 'rphylopic')