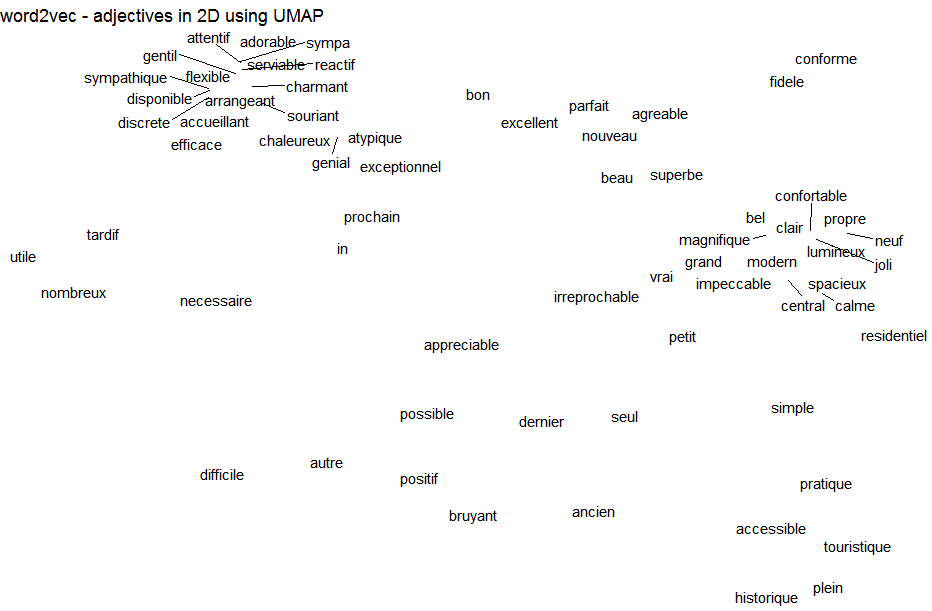
This repository contains an R package allowing to build a word2vec model
install.packages("word2vec")remotes::install_github("bnosac/word2vec")Look to the documentation of the functions
help(package = "word2vec")library(udpipe)
data(brussels_reviews, package = "udpipe")
x <- subset(brussels_reviews, language == "nl")
x <- tolower(x$feedback)library(word2vec)
set.seed(123456789)
model <- word2vec(x = x, type = "cbow", dim = 15, iter = 20)
embedding <- as.matrix(model)
embedding <- predict(model, c("bus", "toilet"), type = "embedding")
lookslike <- predict(model, c("bus", "toilet"), type = "nearest", top_n = 5)
lookslike
$bus
term1 term2 similarity rank
bus voet 0.9891888 1
bus gratis 0.9886125 2
bus tram 0.9885917 3
bus ben 0.9844405 4
bus auto 0.9780166 5
$toilet
term1 term2 similarity rank
toilet koelkast 0.9856260 1
toilet douche 0.9830786 2
toilet wifi 0.9779336 3
toilet voldoende 0.9723337 4
toilet werkte 0.9677669 5write.word2vec(model, "mymodel.bin")
model <- read.word2vec("mymodel.bin")
terms <- summary(model, "vocabulary")
embedding <- as.matrix(model)
library(udpipe)
data(brussels_reviews_anno, package = "udpipe")
x <- subset(brussels_reviews_anno, language == "fr" & !is.na(lemma) & nchar(lemma) > 1)
x <- subset(x, xpos %in% c("NN", "IN", "RB", "VB", "DT", "JJ", "PRP", "CC",
                           "VBN", "NNP", "NNS", "PRP$", "CD", "WP", "VBG", "UH", "SYM"))
x$text <- sprintf("%s//%s", x$lemma, x$xpos)
x <- paste.data.frame(x, term = "text", group = "doc_id", collapse = " ")

model     <- word2vec(x = x$text, dim = 15, iter = 20, split = c(" ", ".\n?!"))
embedding <- as.matrix(model)library(uwot)
viz <- umap(embedding, n_neighbors = 15, n_threads = 2)
## Static plot
library(ggplot2)
library(ggrepel)
df <- data.frame(word = gsub("//.+", "", rownames(embedding)),
xpos = gsub(".+//", "", rownames(embedding)),
x = viz[, 1], y = viz[, 2],
stringsAsFactors = FALSE)
df <- subset(df, xpos %in% c("JJ"))
ggplot(df, aes(x = x, y = y, label = word)) +
geom_text_repel() + theme_void() +
labs(title = "word2vec - adjectives in 2D using UMAP")
## Interactive plot
library(plotly)
plot_ly(df, x = ~x, y = ~y, type = "scatter", mode = 'text', text = ~word)library(word2vec)
model <- read.word2vec(file = "cb_ns_500_10.w2v", normalize = TRUE)predict(model, newdata = c("fries", "money"), type = "nearest", top_n = 5)
$fries
term1 term2 similarity rank
fries burgers 0.7641346 1
fries cheeseburgers 0.7636056 2
fries cheeseburger 0.7570285 3
fries hamburgers 0.7546136 4
fries coleslaw 0.7540344 5
$money
term1 term2 similarity rank
money funds 0.8281102 1
money cash 0.8158758 2
money monies 0.7874741 3
money sums 0.7648080 4
money taxpayers 0.7553093 5wv <- predict(model, newdata = c("king", "man", "woman"), type = "embedding")
wv <- wv["king", ] - wv["man", ] + wv["woman", ]
predict(model, newdata = wv, type = "nearest", top_n = 3)
term similarity rank
king 0.9479475 1
queen 0.7680065 2
princess 0.7155131 3wv <- predict(model, newdata = c("belgium", "government"), type = "embedding")
predict(model, newdata = wv["belgium", ] + wv["government", ], type = "nearest", top_n = 2)
term similarity rank
netherlands 0.9337973 1
germany 0.9305047 2
predict(model, newdata = wv["belgium", ] - wv["government", ], type = "nearest", top_n = 1)
term similarity rank
belgium 0.9759384 1wv <- predict(model, newdata = c("black", "white", "racism", "person"), type = "embedding")
wv <- wv["white", ] - wv["person", ] + wv["racism", ]
predict(model, newdata = wv, type = "nearest", top_n = 10)
term similarity rank
black 0.9480463 1
racial 0.8962515 2
racist 0.8518659 3
segregationists 0.8304701 4
bigotry 0.8055548 5
racialized 0.8053641 6
racists 0.8034531 7
racially 0.8023036 8
dixiecrats 0.8008670 9
homophobia 0.7886864 10
wv <- predict(model, newdata = c("black", "white"), type = "embedding")
wv <- wv["black", ] + wv["white", ]
predict(model, newdata = wv, type = "nearest", top_n = 3)
term similarity rank
blue 0.9792663 1
purple 0.9520039 2
colored 0.9480994 3Need support in text mining? Contact BNOSAC: http://www.bnosac.be